# What Is a Good Conversion Rate for Ecommerce? It Depends on Four Things
Everybody wants a single number, and the honest answer is that a single number is useless. A store selling £8 phone cases and a store selling £4,000 mattresses can both be performing well with conversion rates that differ by a factor of five, and both can be failing at the same rate.
That does not mean the question is unanswerable. It means it needs four variables attached before it means anything, and once you have them you can tell whether your rate is a problem or just a characteristic of what you sell.
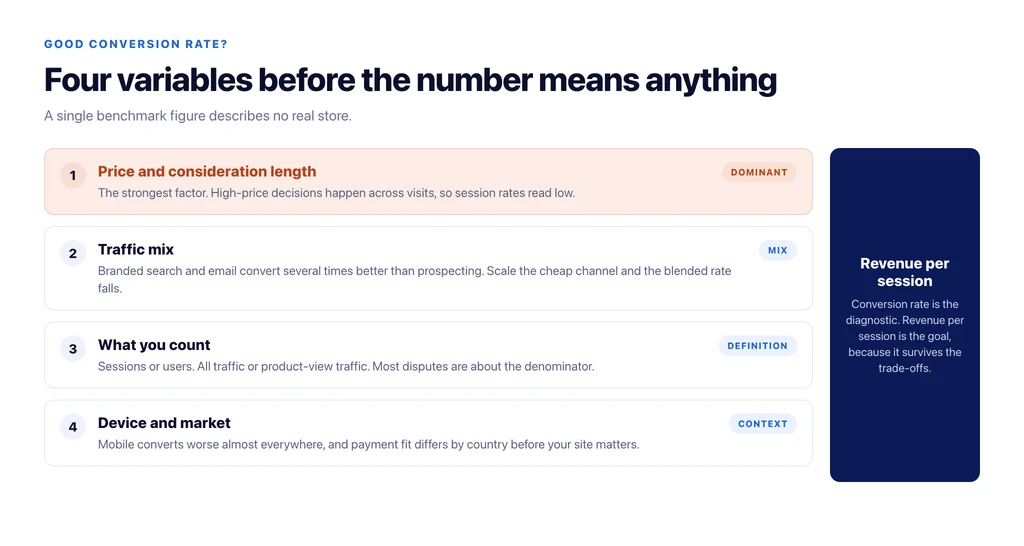
Variable one: price and consideration length
The single strongest determinant. Low-price, low-risk, repeat-purchase items convert at multiples of high-price considered purchases, because the decision costs the shopper almost nothing.
A useful way to think about it: the higher the price, the more of your conversion happens off-site and across visits. Someone buying a mattress reads reviews, asks a partner, waits for a sale, and returns three times. The purchase is credited to the last visit, which makes every earlier visit look like a failure.
For considered purchases, session-level conversion rate is close to meaningless on its own. Return-visitor conversion rate and assisted revenue tell you far more.
Variable two: traffic mix
Conversion rate is a property of the traffic as much as the store. Branded search converts several times better than generic discovery. Email to an existing customer list converts better than both. Paid social prospecting converts worst, and a store that scales it will watch its blended rate fall while revenue rises.
This is why blended conversion rate is a trap. A rising blended rate can mean nothing improved except that a low-intent channel was switched off. Judge each channel against itself over time, and treat the blended number as a mix indicator, not a performance one.
Variable three: what you count
Two stores with identical performance can report different rates depending on the denominator. Sessions or users. All traffic or product-page traffic. Whether bot and internal traffic is excluded. Whether a subscription renewal counts as a conversion.
Before comparing anything, write down your definition. Most disagreements about conversion rate turn out to be arguments about the denominator, and they are settled in a minute by naming it. We set out the arithmetic in ecommerce conversion rate calculator.
Variable four: device and market
Mobile converts materially worse than desktop in almost every catalogue, and the gap is largest for high-consideration goods where people browse on a phone and buy at a laptop. A store with 80% mobile traffic and a store with 50% will report different rates with identical checkout quality.
The same applies across markets: currency, payment methods, delivery expectations and returns policy all move the number before anything on your site does.
So how do you know if your rate is a problem?
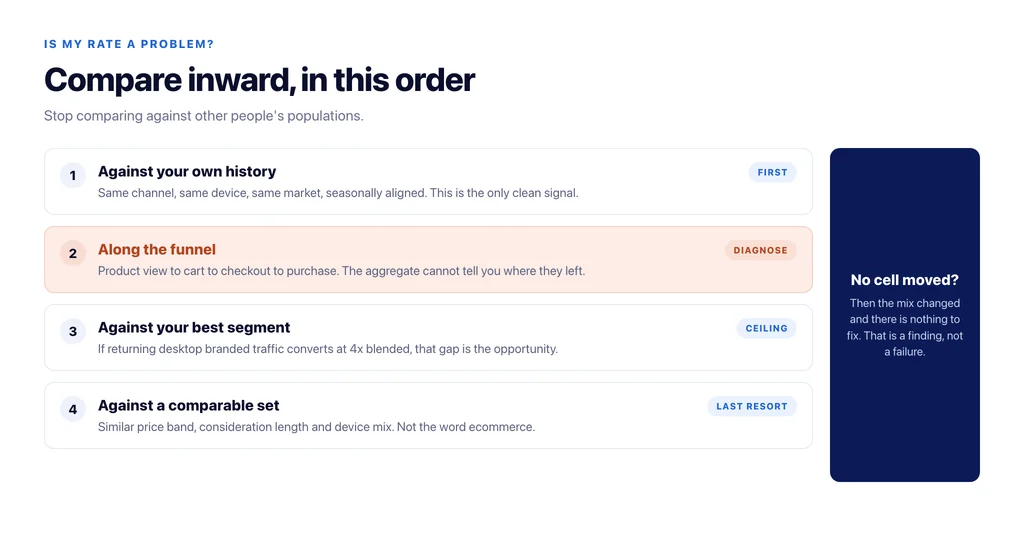
Stop comparing outward and start comparing inward. Four checks, in order:
Against yourself, seasonally adjusted. Is the rate falling for the same channel, device and market compared with the same period last year? That is a real signal.
Along the funnel, not at the end. Product view to add-to-cart, add-to-cart to checkout start, checkout start to purchase. A store with a healthy add-to-cart rate and a collapse at checkout has a checkout problem, and the aggregate rate would never have told you that.
Against your own best segment. If returning desktop visitors from branded search convert at four times your blended rate, the ceiling for the rest is higher than you think, and the gap is the opportunity.
Against a comparable set, if you must. Not “ecommerce”. Similar price band, similar consideration length, similar device mix. How to build that set is covered in ecommerce conversion rate by industry.
The number that matters more
For a store, conversion rate is a diagnostic, not a goal. Revenue per session is the goal, because it survives the trade-offs conversion rate hides.
Discounting raises conversion rate and can lower revenue per session. Removing a high-price product line raises conversion rate and lowers revenue. Adding a low-intent traffic channel lowers conversion rate and raises revenue. In all three cases the conversion rate moved in the direction opposite to the business outcome.
Report both. Use conversion rate to find where shoppers fall out, and revenue per session to decide whether a change was worth making.
Where the sitewide number hides the real one
One more reason to distrust a single figure: a store’s blended rate is an average of segments that behave nothing like each other, and the average moves for reasons that have no operational meaning.
Two examples that come up constantly. A store adds a large blog and its conversion rate falls by a third, because the denominator now includes readers who were never shopping — nothing got worse, and the product-view conversion rate is unchanged. A store expands into a second market and the rate falls again, because the new market has a worse payment fit — that one is real, and the blended figure buries it among everything else.
The habit worth building is to look at the aggregate only to notice movement, then immediately split by channel, device, market and new-versus-returning to find which cell moved. If no cell moved, the mix changed, and there is nothing to fix.
The checklist
- Define the denominator before quoting any rate.
- Segment by channel, device and market before drawing a conclusion.
- Compare against your own history, seasonally adjusted.
- Read the funnel stage by stage, not the aggregate.
- Use your best segment as the ceiling estimate.
- Only benchmark against a genuinely comparable set.
- Track revenue per session alongside, and let it settle trade-offs.
Sources
- Measure ecommerce (GA4) — Google for Developers
- About Analytics sessions — Google Analytics Help
- [GA4] Recommended events — Google Analytics Help
- SEO best practices for ecommerce sites — Google Search Central
Frequently Asked Questions
Want this run against your store? Book a call with The Reach Bureau.