
# Ecommerce Conversion Rate Calculator: The Arithmetic and the Traps
The formula is trivial. Everything that makes the result wrong happens around it. This is the arithmetic, the four denominator choices that change the answer, and how to turn the number into a forecast that survives a finance meeting.
The formula, and the only decision inside it
Conversion rate = conversions ÷ visits × 100.
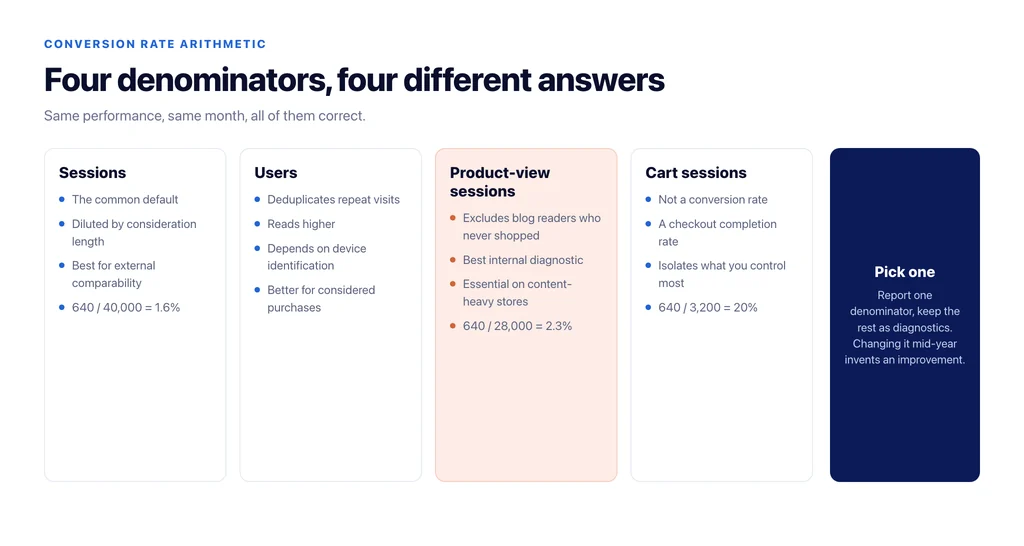
The decision is what counts as a visit. Four options, all defensible, all producing different numbers from identical performance:
Sessions. The common default. A shopper who returns three times before buying produces three sessions and one conversion, so the rate is diluted by consideration length.
Users. Deduplicates the same shopper across visits, so it reads higher. Better for considered purchases, worse for comparing with anyone else’s figure, and dependent on how well the analytics can identify a returning device.
Sessions with a product view. Excludes people who landed on a blog post and left. This isolates shopping behaviour from content traffic, and it is the most useful internal number for a store with a large blog.
Sessions reaching the cart. Not a conversion rate at all — a checkout completion rate. Worth tracking separately because it isolates the part of the funnel you control most directly.
Pick one for external reporting and keep the other three as diagnostics. Changing the denominator halfway through a year is how a store accidentally reports an improvement.
A worked example
Take a month with 40,000 sessions, 28,000 of which included a product view, 3,200 of which reached the cart, and 640 orders at an average order value of £68.
Session conversion rate: 640 ÷ 40,000 = 1.6%. Product-view conversion rate: 640 ÷ 28,000 = 2.3%. Checkout completion rate: 640 ÷ 3,200 = 20%. Revenue: 640 × £68 = £43,520. Revenue per session: £43,520 ÷ 40,000 = £1.09.
Three conversion rates, all correct, all describing the same month. The one worth acting on is the 20%: four in five shoppers who reached the cart did not buy, and that is a specific, addressable problem rather than a general one.
Turning the number into a forecast
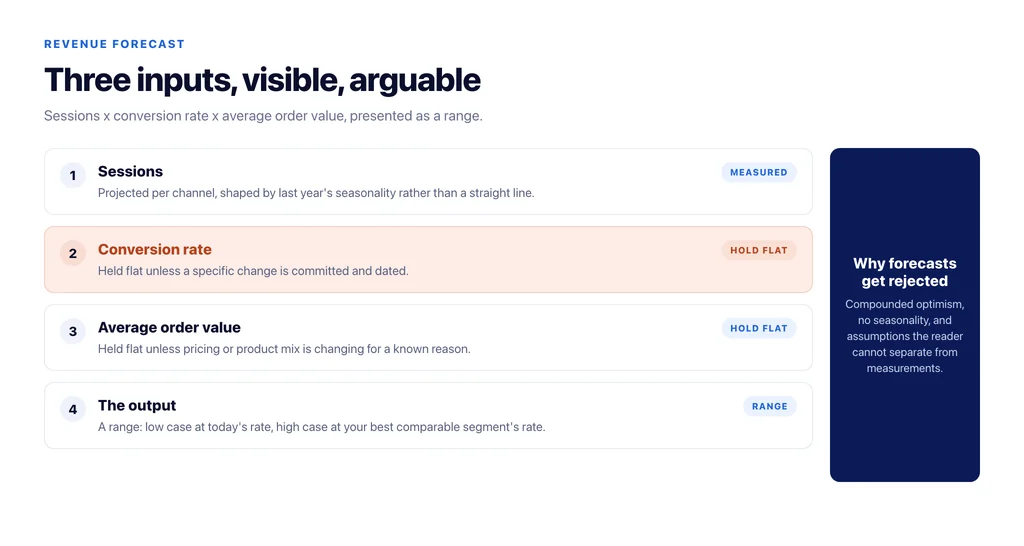
The only forecast worth presenting is one where every input is visible and someone can argue with it. Four inputs:
Sessions, projected from the current trend for the specific channel, seasonally adjusted from last year’s shape rather than extrapolated in a straight line.
Conversion rate, held flat unless there is a specific committed change. Assuming an improvement you have not made is where forecasts lose credibility.
Average order value, held flat unless pricing or mix is changing for a known reason.
Then revenue = sessions × conversion rate × AOV, and the answer should be given as a range, with the low case using the current rate and the high case using your best comparable segment’s rate.
Why forecasts get rejected
Three failure modes, all avoidable.
Compounding improvements. A model that assumes traffic growth and conversion improvement and AOV growth multiplies three optimistic guesses into a number nobody believes.
No seasonality. Straight-line extrapolation from a strong quarter produces a forecast that fails in January and discredits the channel.
No stated assumptions. If the reader cannot see which numbers were assumed and which were measured, the whole model reads as an assertion.
Present the arithmetic, name every assumption, and give the range. A defensible forecast that is lower is worth more than an impressive one that misses.
What to do with a rate you do not like
The arithmetic points at where to work. If the product-view rate is healthy and checkout completion is poor, the problem is in the cart and checkout — payment options, shipping cost revealed late, forced account creation, or a layout that shifts under a thumb. If product-view conversion is weak, the problem is upstream: the traffic is wrong, or the product page does not resolve the decision.
Both diagnoses come from splitting the same 640 orders three ways. Neither is visible in a single blended figure, which is the argument for calculating all three every month.
Three rates that get confused with this one
Stores routinely report one of these and call it conversion rate, and each answers a different question.
Add-to-cart rate. Sessions with an add to cart, divided by sessions with a product view. This measures whether the product page does its job — whether the page resolves the decision. It moves when product content, pricing or imagery changes.
Cart-to-detail ratio. Add-to-cart events divided by product views. Similar, but event-based rather than session-based, so a shopper adding four items counts four times. Useful for merchandising, misleading as a funnel step.
Repeat-purchase rate. Customers with more than one order, over a window. Not a conversion rate at all, and for a consumables catalogue it predicts revenue better than any of the others.
Keep all three visible with their definitions written next to them. The single most common reporting failure in ecommerce is two people comparing numbers that measure different things and concluding that one of them is wrong.
The checklist
- Choose one denominator for reporting and name it every time.
- Calculate session, product-view and checkout completion rates monthly.
- Track revenue per session alongside all three.
- Reconcile order counts against the store database before publishing anything.
- Forecast with sessions, conversion and AOV as separate visible inputs.
- Hold conversion and AOV flat unless a specific change is committed.
- Present a range, and state every assumption in one line each.
Sources
- Measure ecommerce (GA4) — Google for Developers
- About Analytics sessions — Google Analytics Help
- [GA4] Recommended events — Google Analytics Help
- SEO best practices for ecommerce sites — Google Search Central
Frequently Asked Questions
Want this run against your store? Book a call with The Reach Bureau.