
# How Much Should I Spend on Google Ads? Work It Out From Margin
The common answers are a percentage of revenue, whatever the competition spends, or whatever is left after everything else. All three produce a number with no relationship to whether the spend can work.
A budget for a store is derived, not chosen. Four inputs give you a floor, a ceiling and a starting point, and the arithmetic takes twenty minutes.
Start with what an order is worth to you
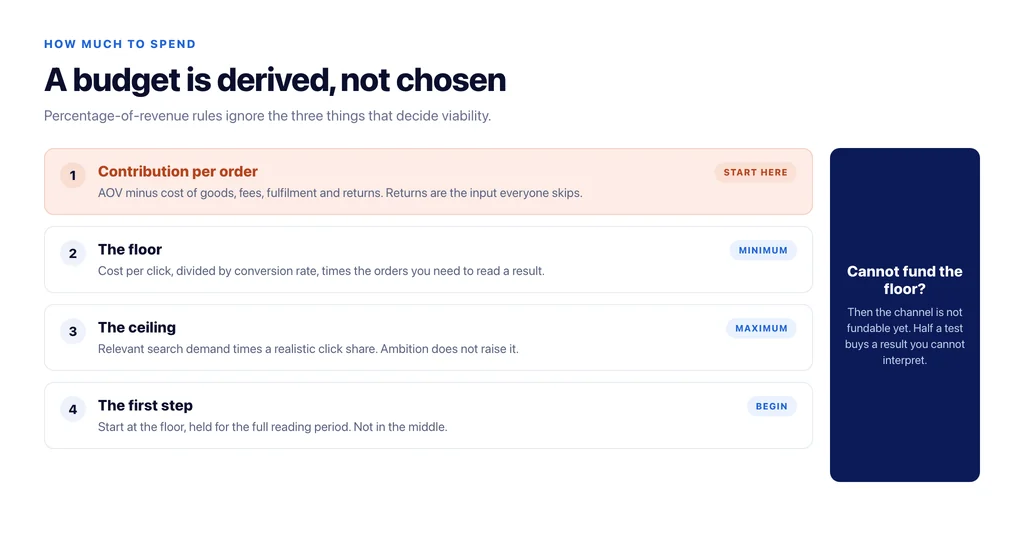
Take average order value and subtract cost of goods, payment fees, fulfilment, and the cost of returns for that category. What remains is contribution per order — the money available to buy the order in the first place.
Returns are the input most often skipped and the one that changes conclusions. A category with a fifth of orders coming back does not have the contribution the top line suggests, and a budget built on the top line will lose money quietly.
Then find the floor: enough to learn
There is a minimum below which spend teaches you nothing. It is not a fixed sum; it is defined by conversions.
To read a result you need enough purchases in a reasonable window — realistically dozens rather than a handful. So: expected cost per click, divided by an assumed conversion rate, gives cost per order. Multiply by the number of orders you need to see a pattern, and that is the monthly floor for a test.
If the floor exceeds what you can commit for three months, the honest conclusion is that this channel is not fundable yet, and the money is better spent on the store or on organic. Half-funding a test buys a result you cannot interpret.
Then the ceiling: available demand
The ceiling is set by how much relevant search demand exists, not by ambition. Keyword volumes for your commercial terms, multiplied by a realistic click share, give a rough limit on how many relevant clicks are purchasable in your category and market.
Past that point additional budget buys progressively less relevant traffic — broader queries, weaker intent — and the return falls even while the reported figure looks similar. Knowing the ceiling in advance is what prevents the “we scaled and it stopped working” conversation.
The starting point, and how to move it
Start at the floor, not in the middle. Run long enough to accumulate the conversions you calculated, then read three things: cost per order against contribution per order, the share of spend going to queries you would choose to buy, and where the funnel lost the clicks you paid for.
Then move in steps of no more than about a third, holding each step until it can be read. Record every change with its date. Three steps in and you have a curve for your own business, which is worth more than any benchmark.
What to do when the numbers do not work
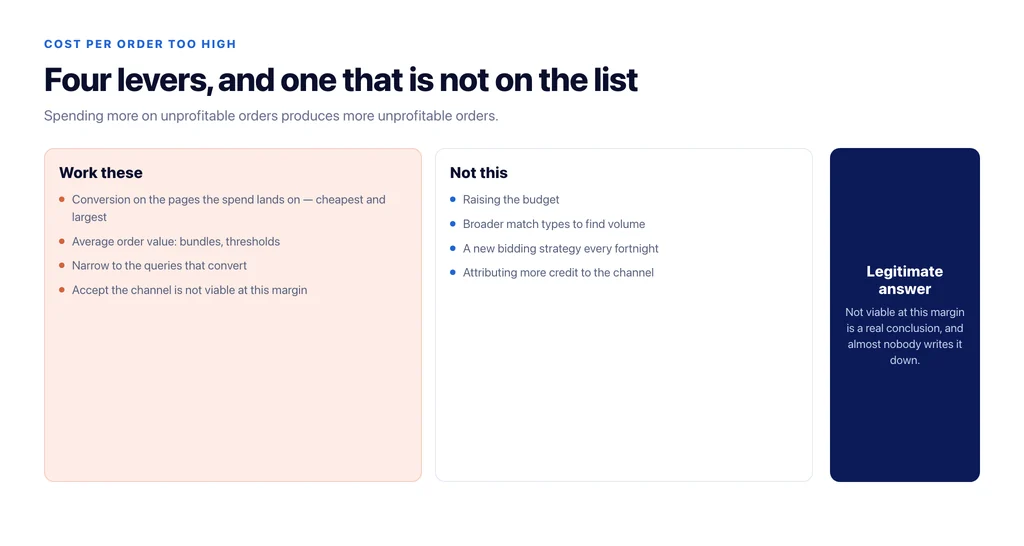
If cost per order sits above contribution per order at the floor, four levers exist, and only one of them is bidding.
Improve conversion on the pages the spend lands on — the cheapest lever, and usually the largest. Raise average order value through bundles or thresholds. Narrow targeting to the queries that convert, accepting less volume. Or accept that this channel is not viable for this catalogue at this margin, which is a legitimate answer that almost nobody writes down.
Turning the budget up is not on that list, because spending more on unprofitable orders produces more unprofitable orders.
Seasonality, and not spending evenly
An equal monthly budget is wrong for almost every catalogue. Demand in most categories concentrates, and the same money spent in peak weeks returns more than in flat ones.
Build the annual number, then distribute it against last year’s demand shape rather than dividing by twelve. Hold a reserve — a tenth is reasonable — for the weeks when demand exceeds forecast, because that is the cheapest revenue in the year and the budget is usually already committed elsewhere.
What a budget conversation should contain
One page: contribution per order, cost per order at current performance, the floor and why, the ceiling and why, the current step and its result, and the next step with a date. The full forecast method sits in the ecommerce conversion rate calculator.
Anything longer tends to be describing activity rather than deciding spend.
What changes the answer more than the budget does
Two variables move the viable spend more than any decision inside the ads account, and both sit outside it.
Average order value. Raising it lifts contribution per order, which raises the cost per order you can afford, which widens the range of queries that become profitable. A threshold, a bundle or a well-placed accessory can move the viable budget more than a month of bid work.
Return rate. Lowering it does the same thing from the other direction, and in categories where returns are structural — apparel, footwear, anything sized — it is the largest single lever on paid viability. Better sizing guidance and clearer fit information reduce returns and therefore raise the budget the same catalogue can support.
This is why budget conversations that stay inside the ads account tend to stall. The number is downstream of margin, and margin is downstream of the store.
The checklist
- Contribution per order calculated after cost of goods, fees, fulfilment and returns.
- Floor derived from the conversions needed to read a result.
- Ceiling estimated from available search demand in your market.
- Start at the floor, held for the full reading period.
- Scale in steps of a third, each read and dated.
- Budget distributed against last year’s demand shape, not evenly.
- A reserve held for weeks when demand beats forecast.
- If cost per order exceeds contribution, work the funnel, not the budget.
Sources
- About Maximize conversion value bidding — Google Ads Help
- About Quality Score for Search campaigns — Google Ads Help
- Measure ecommerce (GA4) — Google for Developers
- Product data specification — Google Merchant Center Help
Frequently Asked Questions
Want this run against your store? Book a call with The Reach Bureau.