
# Ecommerce Conversion Rate Benchmarks: How to Read Them Honestly
Search for ecommerce conversion benchmarks and you will find a dozen figures that contradict each other. They are not lying. They are measuring different things on different populations, and the differences between their methodologies are larger than the differences they report.
This is a guide to reading them without being misled, and to building the only benchmark that can actually tell you something: your own.
Why published benchmarks disagree
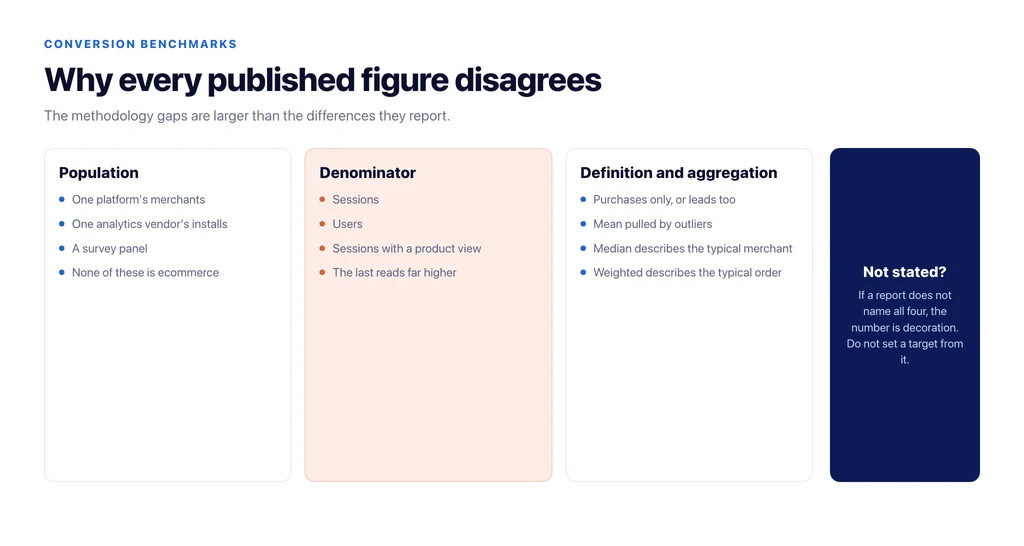
Four methodological choices explain almost all the variance.
The population. A benchmark built from customers of one platform reflects that platform’s typical merchant — often a particular size and vertical. A benchmark from an analytics vendor reflects sites that install that tool. Neither is “ecommerce”.
The denominator. Sessions, users, or visits with a product view. The last of those produces a much higher number for the same performance, and reports rarely lead with which one they used.
The definition of a conversion. Purchases only, or purchases plus leads, subscriptions and account creations. Mixing them inflates the figure in ways you cannot unpick.
The aggregation. A mean across merchants is dominated by outliers; a median tells you about the typical merchant; a weighted average tells you about the typical order. Three legitimate numbers, three different stories.
Before quoting any benchmark, find those four things in the report. If they are not stated, the number is decoration.
What benchmarks are genuinely good for
Three things, and they are worth having.
Sanity-checking an order of magnitude. If your rate is a tenth of every published figure for your category, something is broken — usually tracking rather than the store.
Arguing for investment. A credible external figure moves budget conversations that internal data alone does not.
Segment discovery. Good reports break results down by device, category and market, and those splits often reveal that your weakness is specific rather than general.
What they are not good for is target setting. A target derived from someone else’s population, denominator and definition is a number nobody in your business can act on.
Build the internal baseline first
The benchmark that matters is your own rate for the same segment a year ago, seasonally aligned. Producing it takes an afternoon and makes every subsequent conversation concrete.
Pick the segmentation before you look at the data: channel, device, market, and new versus returning. Then record, for each cell, the conversion rate, revenue per session, and volume. Volume matters because a cell with a hundred sessions will swing wildly and invite you to chase noise.
Store it somewhere permanent and dated. The most common failure is not the absence of a baseline but the absence of a record of what the baseline was before somebody changed the tracking.
Watch out for the tracking break
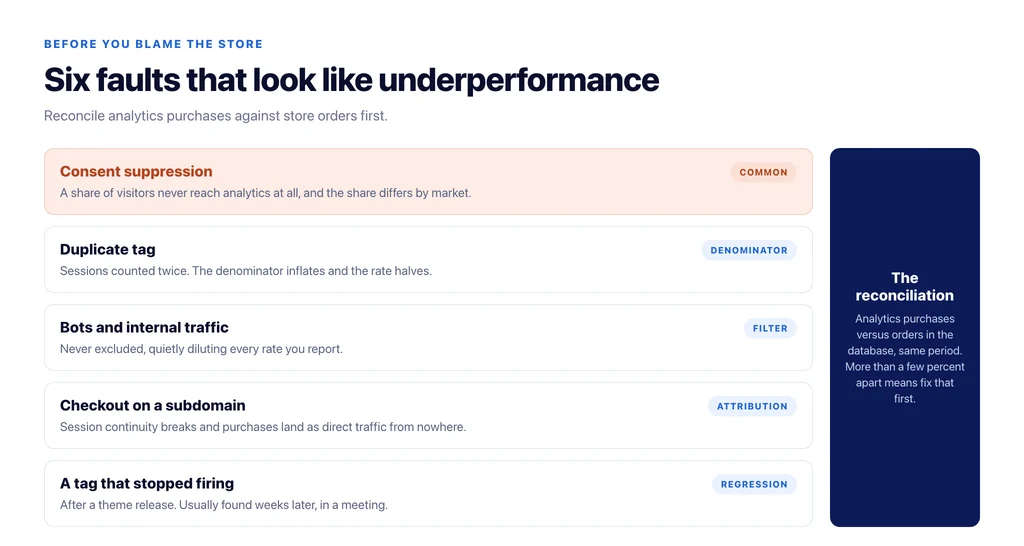
Half of dramatic benchmark gaps are measurement artefacts. The recurring causes, in rough order of frequency: consent banners suppressing analytics for a share of visitors, a duplicate tag double-counting sessions, bot traffic in the denominator, internal and staff traffic never excluded, a checkout on a subdomain breaking session continuity, and a tag that stopped firing after a theme release.
Before concluding that your store underperforms the benchmark, reconcile analytics purchases against orders in the store’s own database for the same period. If those two numbers disagree by more than a few percent, fix that before interpreting anything.
Comparing across periods without fooling yourself
Seasonality dominates ecommerce conversion. Comparing November to September tells you about the calendar, not the store.
Compare like periods year on year, and where the year-on-year comparison is polluted by a known event — a migration, a price change, a channel switched off — annotate it rather than smoothing it away. An annotated timeline of what changed is more valuable than any external benchmark, because it lets you attribute movements instead of guessing at them.
Where the number should sit in reporting
Conversion rate belongs next to revenue per session and next to the funnel stages it summarises, never alone. On its own it invites the two classic misreadings: a rise caused by turning off cheap traffic, and a fall caused by successful expansion into it.
The related definitional questions — what counts as good, and what denominator to use — are covered in what is a good conversion rate for ecommerce.
What to record every month, in one table
Benchmarks fail as a practice, not just as numbers, because nobody keeps a record. The fix is a small monthly table that takes ten minutes and compounds in value.
One row per segment — channel, device, market, new or returning. Five columns: sessions, conversion rate, revenue per session, average order value, and a notes field for anything that changed. The notes column is the one that earns its place: a migration, a price rise, a tag redeployment, a channel switched off. Twelve months of that turns every future question about a movement into a lookup instead of an investigation.
Keep it outside the analytics tool. Interfaces change, historical processing gets revised, and access gets lost between agencies. A dated table in a spreadsheet survives all three.
The checklist
- For any external benchmark, find the population, denominator, conversion definition and aggregation method.
- Discard any figure that does not state them.
- Build your own segmented baseline and date it.
- Reconcile analytics purchases against store orders before drawing conclusions.
- Compare like periods year on year, with annotations for known events.
- Report conversion rate beside revenue per session and the funnel stages.
- Set targets from your own best segment, not from someone else’s average.
Sources
- Measure ecommerce (GA4) — Google for Developers
- How Google Analytics works — Google Analytics Help
- Cart abandonment rate statistics — Baymard Institute
- SEO best practices for ecommerce sites — Google Search Central
Frequently Asked Questions
Want this run against your store? Book a call with The Reach Bureau.