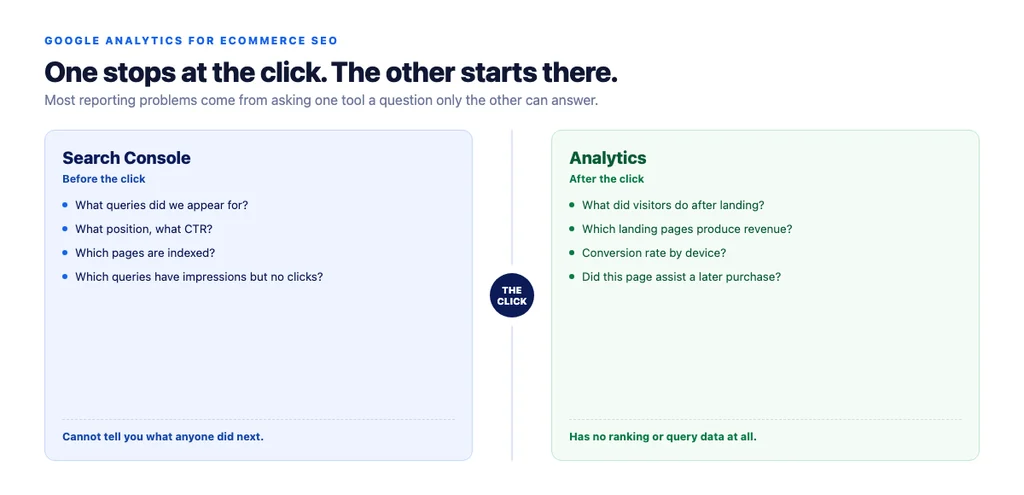
Google Analytics tells you what happened after someone arrived. Search Console tells you what happened before. Most SEO reporting problems come from asking one of them a question only the other can answer.
That division is the whole framework. Once it is clear, the reports you need on an ecommerce store are a short list — and so are the setup mistakes that quietly make every number wrong.
Which tool answers which question
| Question | Tool |
|---|---|
| What queries did we appear for? | Search Console |
| What position, what click-through rate? | Search Console |
| Which pages are indexed? | Search Console |
| What did visitors do after landing? | Analytics |
| Which landing pages produce revenue? | Analytics |
| What is the conversion rate by device? | Analytics |
| Did this page assist a later purchase? | Analytics |
Search Console stops at the click. Analytics starts there. Neither shows the whole path, and no amount of configuration makes one do the other's job.
The setup that makes the data usable
Link Search Console to Analytics. It puts query data alongside behaviour data in one interface. Not a substitute for using Search Console directly, but it removes a lot of tab-switching.
Ecommerce events must actually fire. view_item, add_to_cart, begin_checkout, purchase. Test each one manually on the live site and confirm it appears. A surprising number of stores report on purchase data that is missing a variant of the checkout flow.
Revenue must match your platform. If Analytics says one number and your store admin says another, find out why before reporting either. Common causes: purchases firing twice, refunds not excluded, tax and shipping counted inconsistently.
Filter internal traffic. Your own team browsing the site inflates everything, and on a low-traffic store it can dominate.
Mark your own domain as unwanted referral. Payment gateway redirects otherwise split a single session into two, attributing the purchase to the gateway rather than to organic.
Set up channel groups deliberately. Check that AI assistant referrals — chatgpt.com, perplexity.ai — are not being dumped into an undifferentiated "referral" bucket. They are small and growing, and worth seeing separately.
The reports that matter
Organic landing pages by revenue. The single most useful view. Which pages, arrived at from search, produce money.
Organic conversion rate by landing page. Not site-wide. A blended figure hides that your category pages convert at a fraction of your product pages, or the reverse.
Organic by device. Mobile and desktop conversion rates differ enough that a blended number misleads about both.
Assisted conversions from organic. Content and category pages sit early in the path; last-click attribution makes them look worthless and gets their budget cut.
New versus returning from organic. A store acquiring new customers from search is doing something different from one where organic is mostly returning buyers navigating by brand.
Landing page engagement for pages you changed. Time on page and scroll depth on rewritten pages, compared to before. Slow-moving but honest.
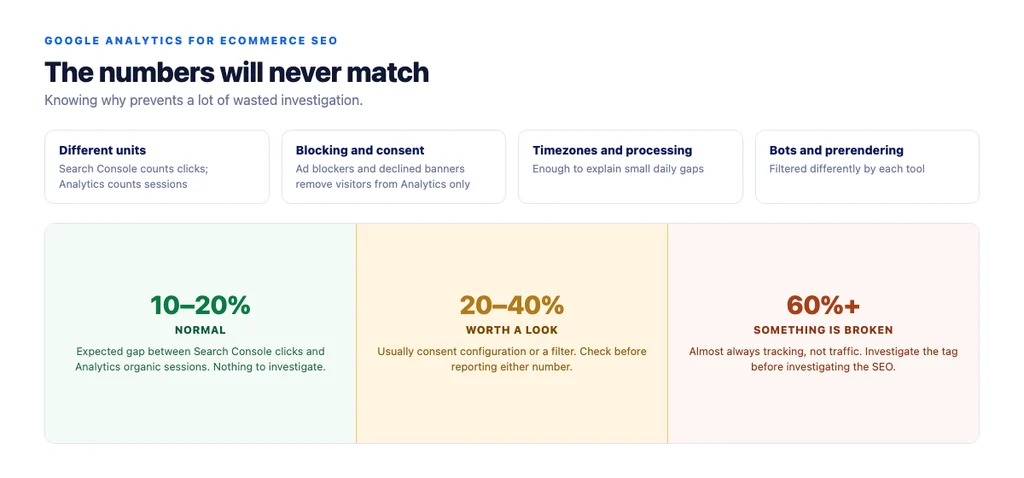
Why the two tools disagree
They always will, and knowing why prevents a lot of wasted investigation.
- Different units. Search Console counts clicks; Analytics counts sessions. One click can become several sessions, and some clicks never become a session at all.
- Blocking and consent. Ad blockers and declined consent banners remove visitors from Analytics. Search Console does not depend on client-side script, so it sees them.
- Different timezones and processing windows. Enough to explain small daily gaps.
- Bots and prerendering. Filtered differently by each.
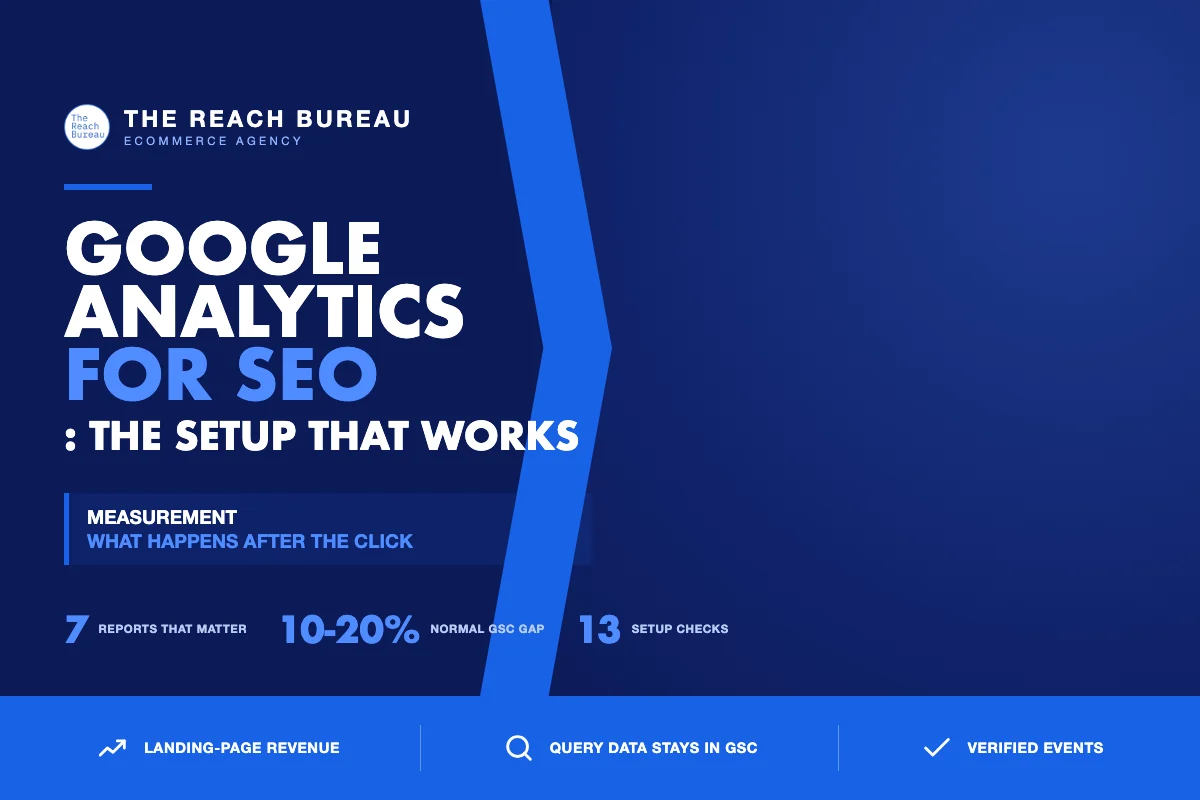
A gap of 10–20% between Search Console clicks and Analytics organic sessions is normal. A gap of 60% means something is broken — usually tracking, not traffic.
The mistakes that make data useless
- Reporting site-wide conversion rate as an SEO metric. It blends paid, direct, email and organic across every page type.
- Judging content on last-click. Guaranteed to undervalue anything early in the path.
- Comparing to an industry benchmark instead of to your own trend and a control group.
- Not annotating changes. Six months later nobody remembers what happened in March, and every trend becomes speculation.
- Reading Analytics for ranking questions. It does not have them. This is where the framework at the top pays off.
A monthly routine
1. Organic revenue by landing page, versus last month and last year. 2. Conversion rate by landing page for the pages you worked on, plus the control group. 3. Device split for anything that moved. 4. Assisted conversions for content pages. 5. Annotate every change you made, with the date. 6. Cross-check one number against Search Console — if the gap has changed shape, investigate tracking before investigating traffic.
The checklist
- Search Console linked to Analytics
view_item,add_to_cart,begin_checkout,purchaseall manually verified on the live site- Analytics revenue reconciled against store admin revenue
- Refunds handled consistently
- Internal traffic filtered
- Own domain and payment gateways marked as unwanted referrals
- AI assistant referrals visible as their own channel
- Organic revenue reported by landing page, not site-wide
- Conversion rate segmented by landing page and device
- Assisted conversions used for content pages
- Control group tracked alongside changed pages
- Every change annotated with a date
- Search Console used for query and position questions, never Analytics
Sources
- SEO Best Practices for Ecommerce Sites — Google Search Central
- Google Search Essentials — Google Search Central
- Ecommerce Product Data and Content on Google — Google Search Central
- Creating Helpful, Reliable, People-First Content — Google Search Central
- Intro to Product Structured Data on Google — Google Search Central
Frequently Asked Questions
Want this run against your store? Book a call with The Reach Bureau.