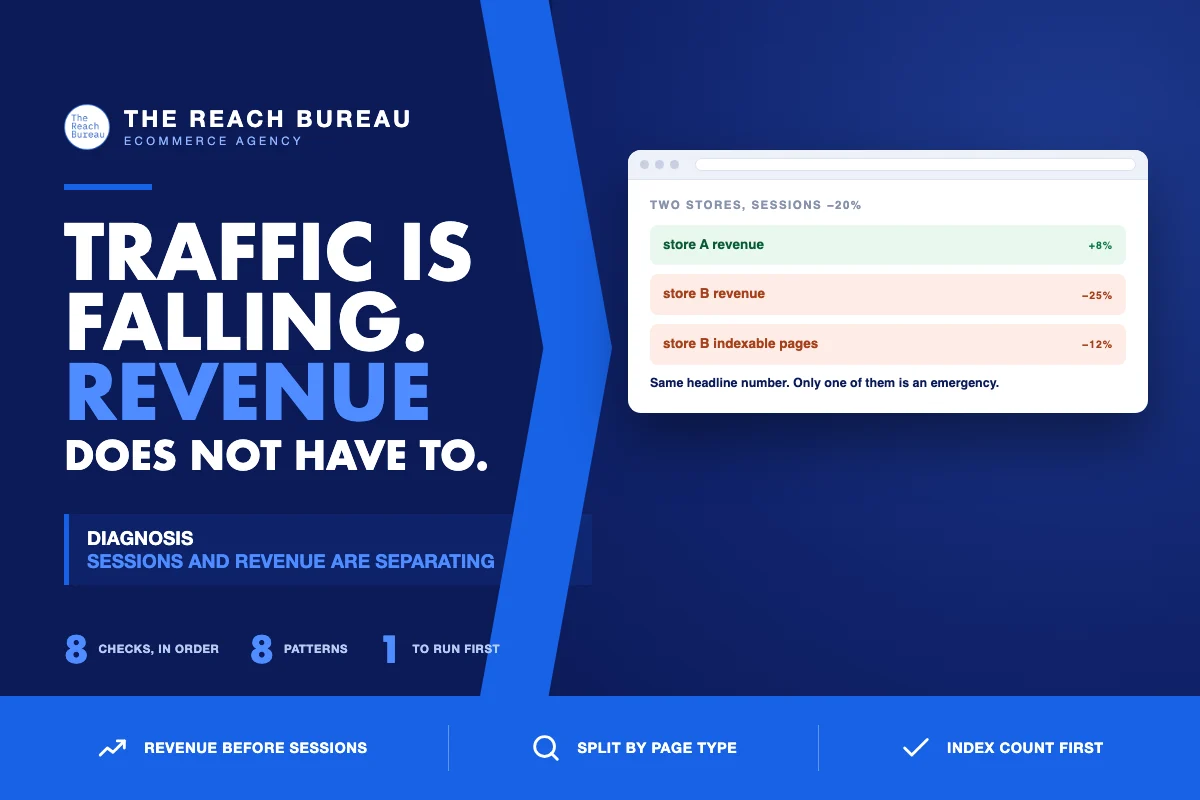
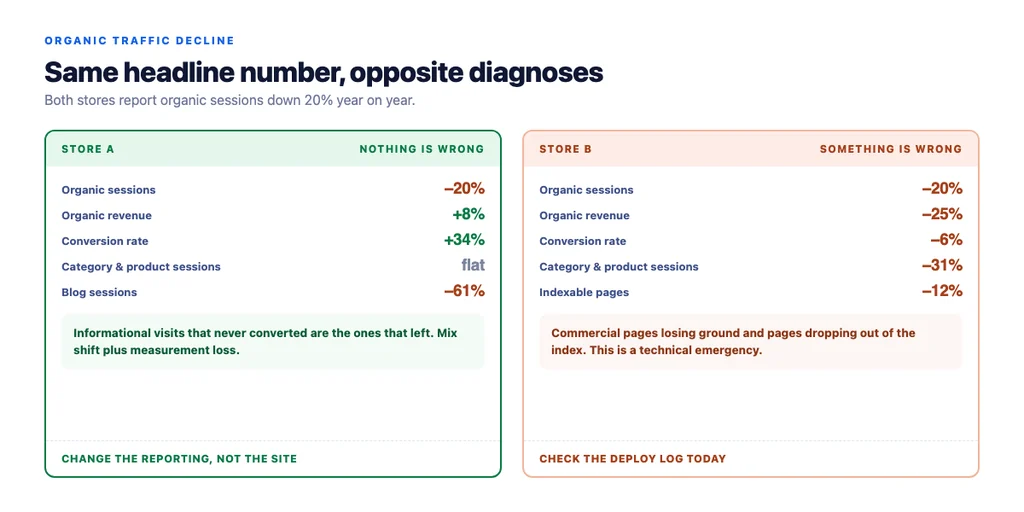
Two stores report the same thing: organic sessions down 20% year on year. In one, revenue is down 25% and something is badly wrong. In the other, revenue is up 8% and nothing is wrong at all.
Sessions and revenue used to move together closely enough that traffic was a reasonable proxy. They are coming apart, and a lot of teams are about to panic about a number that no longer means what it meant.
Why sessions and revenue are separating
Questions get answered before the click. Informational visits that never converted are the first to disappear. Losing them costs sessions and almost no revenue.
Assistants send fewer, better visits. Someone arriving after an assistant has already narrowed the choice is much closer to buying. Fewer sessions, higher conversion rate.
Measurement itself is shrinking. Ad blockers and declined consent remove real visitors from analytics. Some of your "decline" is people you still have and can no longer see.
Marketplaces absorb the browsing stage. Discovery happens there; the visit to your site happens later and looks direct or branded.
Comparison happens off-site. Reviews, forums, video. The visitor arrives having decided, so your own comparison pages get fewer visits and your product pages convert better.
None of that is a reason to be relaxed about a real decline. It is a reason to check which kind you have before acting.
How to tell which you have
Run these in order. It takes an hour and prevents a quarter of wasted work.
1. Look at revenue from organic, not sessions. If revenue is flat or up, you have a measurement and mix change, not a traffic problem. 2. Split branded and unbranded. Branded falling is a demand problem. Unbranded falling with branded holding is usually a visibility problem. 3. Split by page type. Category and product declining is serious. Blog declining while commercial pages hold is the absorption pattern, and much less serious. 4. Split by intent within unbranded. Informational queries losing clicks while impressions hold is answers being absorbed above the results. 5. Check conversion rate per session. Rising conversion alongside falling sessions is the healthy version of this story. 6. Check Search Console against analytics. If the gap between clicks and sessions has widened, part of your decline is tracking, not traffic. 7. Check indexed page count. A fall here is a technical problem, and it is the one that actually is an emergency. 8. Check your top 20 revenue pages individually. A site-wide average hides one category collapsing.
Step 7 is the one to run first if you only run one. Everything else can wait a day; a page-count drop cannot.
The patterns and what each means
| What you see | Most likely cause | Urgency |
|---|---|---|
| Sessions down, revenue up, conversion up | Mix shift and measurement loss | Low — report it properly |
| Sessions down, revenue down, conversion flat | Real visibility loss | High |
| Branded down | Demand or brand problem, not SEO | High, different team |
| Blog down, commercial flat | Answers absorbed above results | Low — repurpose the pages |
| Category pages down specifically | Technical, cannibalisation or competitor gain | High |
| Indexed count down | Technical fault | Emergency |
| Impressions flat, clicks down | Something above you in the results | Medium |
| Everything down at one date | A change you shipped, or an update | High — check the deploy log |
What to report instead of sessions
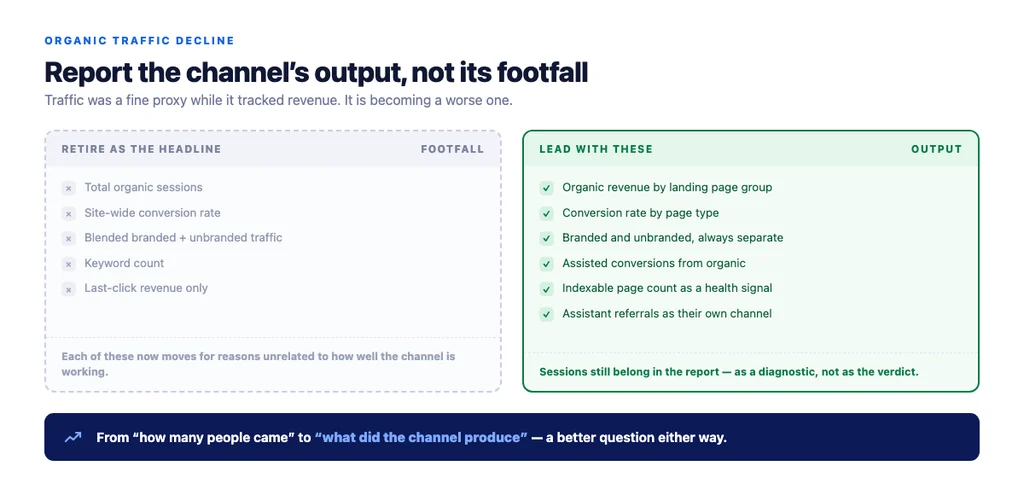
If traffic is becoming a weaker proxy, reporting has to change or the conversation gets worse every quarter.
- Organic revenue by landing page group. The number the business actually cares about.
- Conversion rate by page type, so mix shifts are visible rather than confusing.
- Branded and unbranded separately, always.
- Assisted conversions from organic, so content is not judged on last click.
- Indexed and indexable page counts, as a health signal.
- Impressions and average position as leading indicators, with the caveat that impressions inflate when you appear low on more queries.
- Assistant referral sessions as their own channel, small but worth watching.
The shift is from "how many people came" to "what did the channel produce". That is a better question anyway; it was just easier to dodge when traffic and revenue moved together.
What to actually do about it
If it is a real decline: it is ordinary SEO work. Find which pages lost which queries, check what changed, fix the technical faults, improve the pages that lost ground, and rebuild the internal linking that pointed at them.
If it is absorption: stop investing in content that answers fully-answerable questions, repurpose the affected pages as conversion assists, and move the budget to category and product pages.
If it is measurement: fix what you can — consent configuration, unwanted referrals, gateway attribution — and then re-baseline. Reporting against a baseline you know is incomplete is worse than resetting it.
If it is mix shift: change the reporting, and say so before someone else notices the sessions line and draws their own conclusion.
The checklist
- Indexed page count checked first
- Organic revenue examined before sessions
- Branded and unbranded split
- Page-type split — category, product, article
- Intent split within unbranded
- Conversion rate per session compared year on year
- Search Console clicks versus analytics sessions gap re-checked
- Top 20 revenue pages inspected individually
- Deploy log checked around any step change
- Consent and tracking configuration verified
- Reporting switched to revenue by landing page group
- Assisted conversions included for content pages
- Assistant referrals visible as their own channel
- Baseline reset explicitly if measurement changed
Sources
- Google Search Console Help — Google
- SEO Best Practices for Ecommerce Sites — Google Search Central
- Google Search Essentials — Google Search Central
- Creating Helpful, Reliable, People-First Content — Google Search Central
- Block Search Indexing with noindex — Google Search Central
Frequently Asked Questions
Want this run against your store? Book a call with The Reach Bureau.