Search Console knows which queries brought people in. Analytics knows which landing pages made money. Neither knows which *query* made money, because the join between them is broken by design — Google does not pass the query into your analytics.
That gap is why most keyword prioritisation still runs on search volume, which is a proxy for how many people are looking rather than for how much they are worth. Volume and value diverge enormously on an ecommerce store, and closing the gap approximately is worth far more than ranking a high-volume term that never converts.
Why you cannot just look it up
- Query data is not passed to analytics. It has not been since secure search, and no configuration restores it.
- Search Console's API stops at the click. Impressions, clicks, position, page. No revenue.
- The connector helps but does not solve it. Linking Search Console to analytics puts the two datasets side by side; it does not join query to conversion.
So the honest method is an approximation at page level, and the discipline is knowing exactly how approximate it is.
The page-level join
This is the practical method, and it is good enough to change decisions.
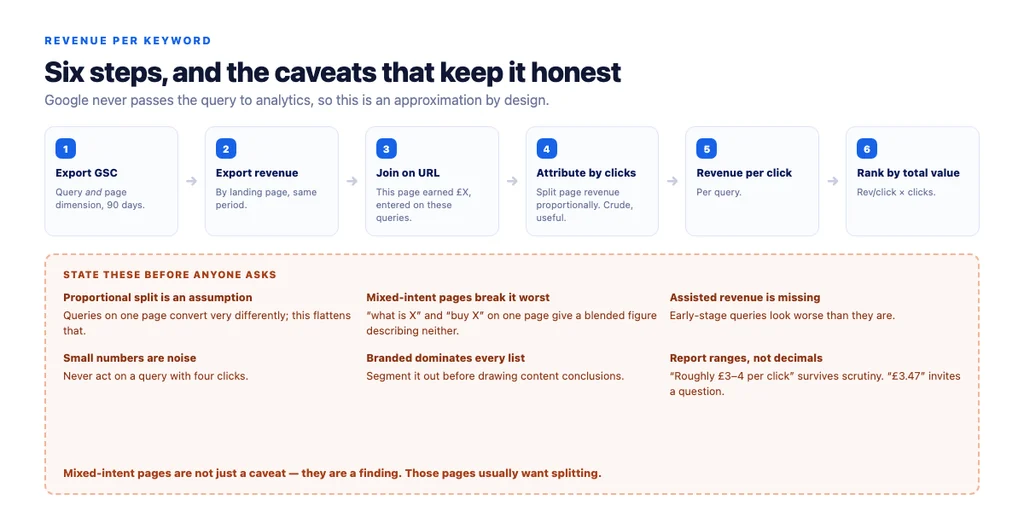
1. Export Search Console query-and-page data for the period. You need the page dimension, not queries alone. 2. Export organic revenue by landing page from analytics for the same period. 3. Join on the URL. Now you know: this page earned £X and was entered on these queries. 4. Attribute revenue across the page's queries in proportion to clicks. Crude, but directionally useful. 5. Compute revenue per click for each query. 6. Rank by revenue per click × clicks — the total value the query actually delivered.
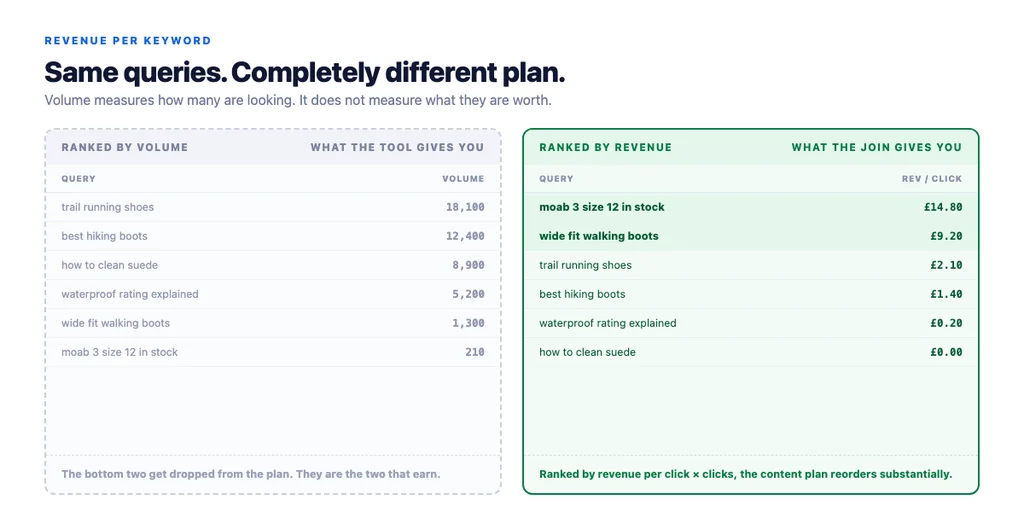
The output is a keyword list ordered by money rather than by volume, and it usually looks very different from the one your keyword tool produced.
What the join gets wrong
Be explicit about this, because someone will ask.
- Proportional attribution is an assumption. Within one page, some queries convert far better than others, and this method flattens that.
- A page serving mixed intent breaks it worst. A page entered on both "what is X" and "buy X" gets a blended figure that describes neither.
- Assisted revenue is missing unless you use an assisted metric. Early-stage queries will look worse than they are.
- Small numbers are noise. Do not act on a query with four clicks.
- Branded queries dominate revenue per click and will sit at the top of every list. Segment them out before drawing conclusions about content.
Mitigations: run it over 90 days rather than 30, exclude queries under a click threshold, report branded separately, and treat mixed-intent pages as a finding — they usually want splitting anyway.
What to do with the result
Find high-value, low-position queries. A query earning well per click but ranking at position 12 is the highest-return work available on the store.
Find high-volume, zero-value queries you are investing in. These are the ones a volume-led plan chases and a revenue-led plan drops.
Find the queries with value and no dedicated page. Real demand, earning money via a page that only partly serves it — the clearest case for a new page you will ever get.
Reprioritise the content plan. Ranked by revenue per click rather than volume, the plan reorders substantially, and the reordering is defensible to anyone holding the budget.
Set bids and organic priorities coherently. If you run paid, the same list tells you where organic can take over.
Find mixed-intent pages — a wide spread of revenue per click within one page is a signal that one page is doing two jobs.
A simpler proxy when the join is too much
If exporting and joining is not realistic, two cheaper signals get you most of the way:
- Query intent classification. Group queries into commercial, comparison and informational. Rank within group rather than across. Crude, immediate, and prevents the worst prioritisation errors.
- Landing page revenue alone. Rank pages by revenue, then work on the queries those pages already rank for. Skips the attribution step entirely and still points at the right pages.
Neither is as good as the join. Both beat ranking by volume.
Reporting it without overclaiming
- Say it is an approximation and describe the method in one sentence.
- Report branded and unbranded separately, every time.
- Use ranges rather than precise figures. "Roughly £3–4 per click" survives scrutiny; "£3.47" invites a question you cannot answer.
- Show the click threshold you applied.
- Pair it with assisted revenue for early-stage queries, or state that they are undercounted.
- Re-run quarterly. Query mix shifts, and the list goes stale.
The checklist
- Search Console query-and-page data exported with the page dimension
- Organic revenue by landing page exported for the same period
- Joined on URL, 90-day window
- Revenue attributed across queries proportionally to clicks
- Revenue per click computed per query
- Queries below a click threshold excluded
- Branded queries segmented out before conclusions
- Mixed-intent pages flagged as split candidates
- High-value low-position queries identified as first priority
- High-volume zero-value queries identified and dropped
- Value-bearing queries with no dedicated page listed
- Content plan reordered by revenue rather than volume
- Method stated in the report, figures given as ranges
- Assisted revenue included or its absence stated
- Re-run scheduled quarterly
Sources
- Google Search Console Help — Google
- Performance Report in Search Console — Google
- SEO Best Practices for Ecommerce Sites — Google Search Central
- Google Search Essentials — Google Search Central
- Creating Helpful, Reliable, People-First Content — Google Search Central
Frequently Asked Questions
Want this run against your store? Book a call with The Reach Bureau.