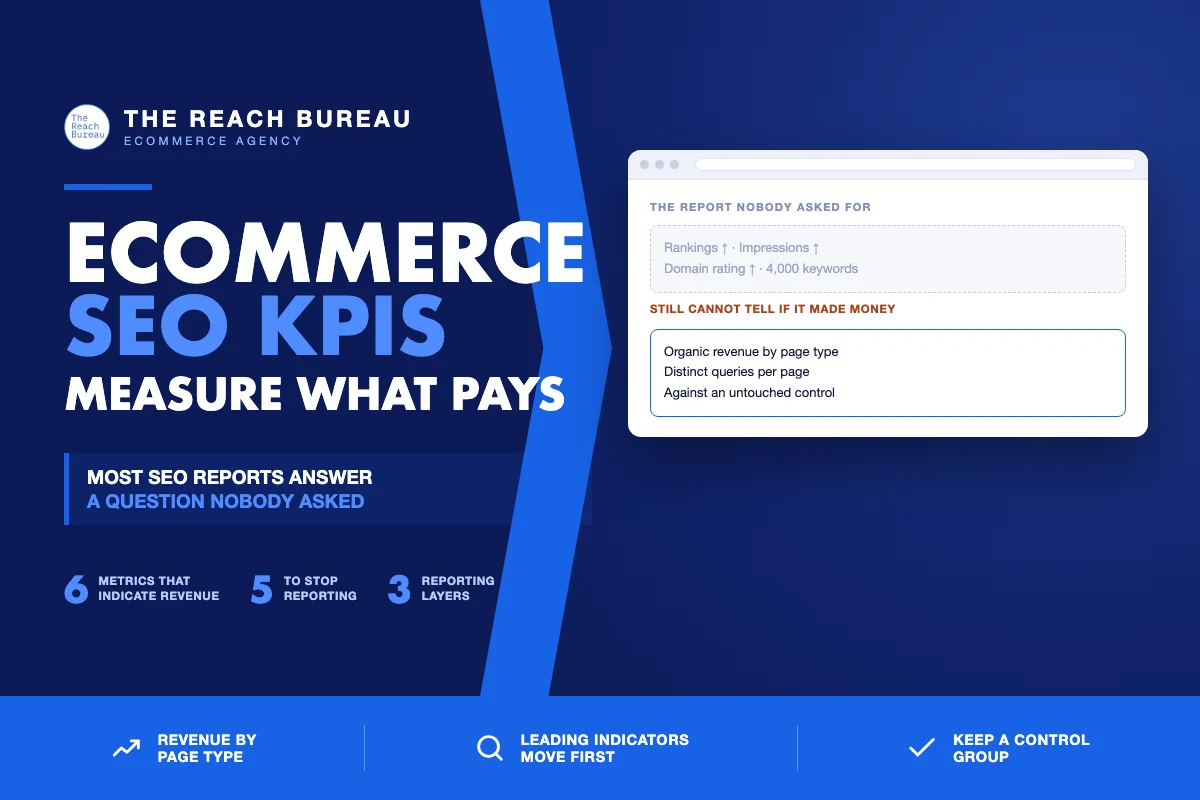
Most SEO reports answer a question nobody asked.
Rankings went up, impressions grew, the domain rating ticked along — and the founder reading it still cannot tell whether the work made money. That gap is not a reporting problem. It is a metric-selection problem, and it starts with tracking what is easy to measure rather than what indicates revenue.
This is what to track on an ecommerce store, why, and what to stop reporting.
The metrics that indicate revenue
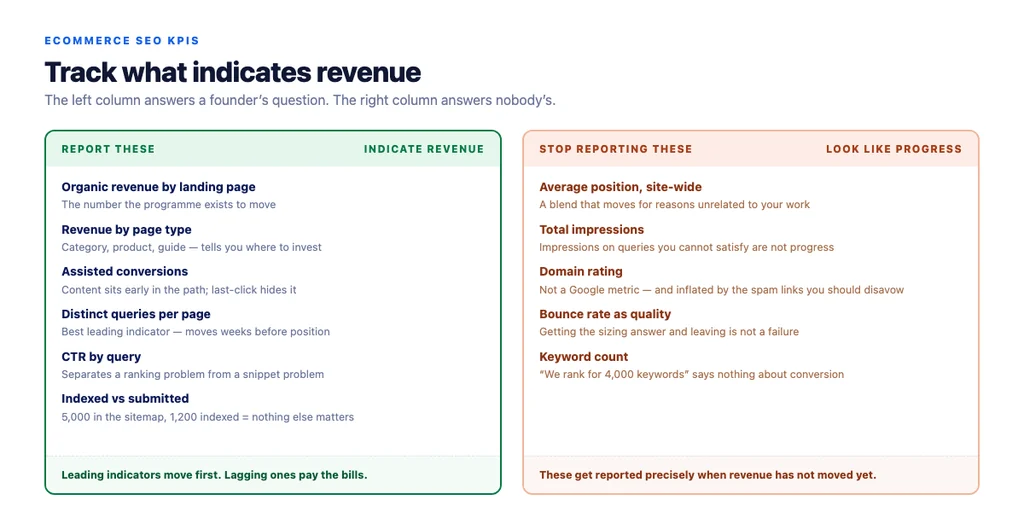
Organic revenue by landing page. The number the whole programme exists to move. Segmented by landing page, because a site-wide figure hides which work paid.
Organic revenue by page type. Category, product, guide. This tells you where to invest next, and it is the view most stores have never built.
Assisted conversions from organic. Content sits early in the path. Judging a buying guide on last-click makes it look worthless, and that is how content budgets get cut for the wrong reason.
Distinct queries per page. The best leading indicator there is. A page that starts appearing for phrasings you never targeted is getting better, and this moves weeks before position does.
Click-through rate by query. Separates a ranking problem from a snippet problem. Position 4 with a 1% CTR is a title and description issue, not a rankings issue.
Indexed-versus-submitted ratio. If you have 5,000 URLs in the sitemap and 1,200 indexed, no amount of content work matters until you know why.
The metrics to stop reporting
Average position, site-wide. A blend across thousands of queries that moves for reasons unrelated to your work. Moving from position 30 on a broad term to position 12 on a commercial one looks flat here while revenue rises.
Total impressions, unqualified. Impressions on queries you cannot satisfy are not progress. Rising impressions with flat clicks usually means you are surfacing for the wrong things.
Domain rating. A third-party score, not a Google metric. Useful for competitive comparison; meaningless as a KPI, and trivially inflated by exactly the spam links you should be disavowing.
Bounce rate as a quality signal. A shopper who lands on a product page, gets the answer about sizing, and leaves to think about it is not a failure.
Keyword count. "We now rank for 4,000 keywords" says nothing about whether any of them convert.
Building the view
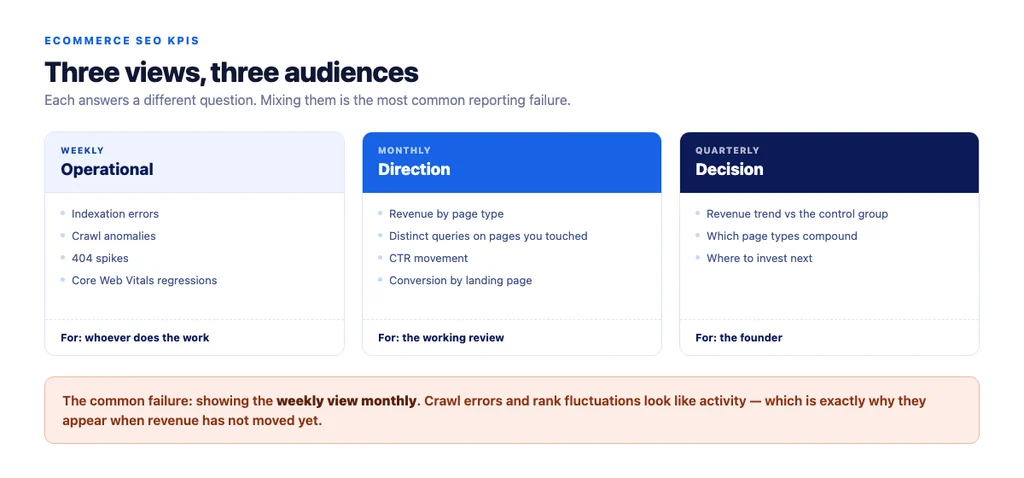
Three levels, each for a different audience.
Weekly — operational. Indexation errors, crawl anomalies, 404 spikes, Core Web Vitals regressions. Things that need action this week. Nobody outside the SEO work needs to see this.
Monthly — direction. Organic revenue by page type, distinct queries per page for the pages you worked on, CTR movement, conversion by landing page. This is the working review.
Quarterly — decision. Revenue trend against the control group, which page types are compounding, what to invest in next quarter. This is the one a founder should read.
The most common failure is showing the weekly view monthly. Crawl errors and rank fluctuations look like activity, which is exactly why they get reported when the revenue numbers are not moving yet.
The control group nobody keeps
Seasonality moves everything. Without a comparison set you cannot separate your work from the season, and every report becomes an argument about attribution.
Before starting a programme of work, pick a set of comparable pages and leave them untouched. Same page type, similar traffic, similar competition. Track them alongside the ones you change.
It costs nothing, and it is the difference between "traffic is up 20%" and "traffic is up 20% against a control that is up 4%."
Attribution, honestly
Last-click attribution systematically undervalues SEO on ecommerce, because organic frequently starts the journey and paid or direct finishes it.
- Use assisted conversions for content and category pages.
- Compare attribution models rather than picking one. If a page looks worthless on last-click and valuable on first-click, that is information, not noise.
- Accept the uncertainty. Precise attribution across a multi-touch path does not exist. A directional model consistently applied beats a precise model applied once.
What a good monthly report contains
1. Revenue from organic, by page type, against last month and last year. 2. What changed — the specific work done, with dates. 3. Leading indicators on the pages you touched — distinct query count, CTR, position for the primary term. 4. The control group, same metrics. 5. What is blocked — technical issues, access problems, decisions needed. 6. What is next, and why that rather than something else.
Six sections. No chart of average position across the site.
The checklist
- Organic revenue tracked by landing page
- Organic revenue segmented by page type
- Assisted conversions included for content pages
- Distinct query count tracked per page
- CTR tracked by query, not just site-wide
- Indexed-versus-submitted ratio monitored
- Control group of untouched comparable pages established
- Weekly operational view kept separate from monthly review
- Quarterly view built around decisions, not activity
- Average site-wide position removed from reporting
- Domain rating removed from KPIs
- Every reported change tied to specific dated work
Sources
- SEO Best Practices for Ecommerce Sites — Google Search Central
- Google Search Essentials — Google Search Central
- Creating Helpful, Reliable, People-First Content — Google Search Central
- Ecommerce Product Data and Content on Google — Google Search Central
- Intro to Product Structured Data on Google — Google Search Central
Frequently Asked Questions
Want this run against your store? Book a call with The Reach Bureau.