PDP A/B Testing: What’s Worth Testing in 2026
July 29, 2026
3 min read
by Max Tymoshyn
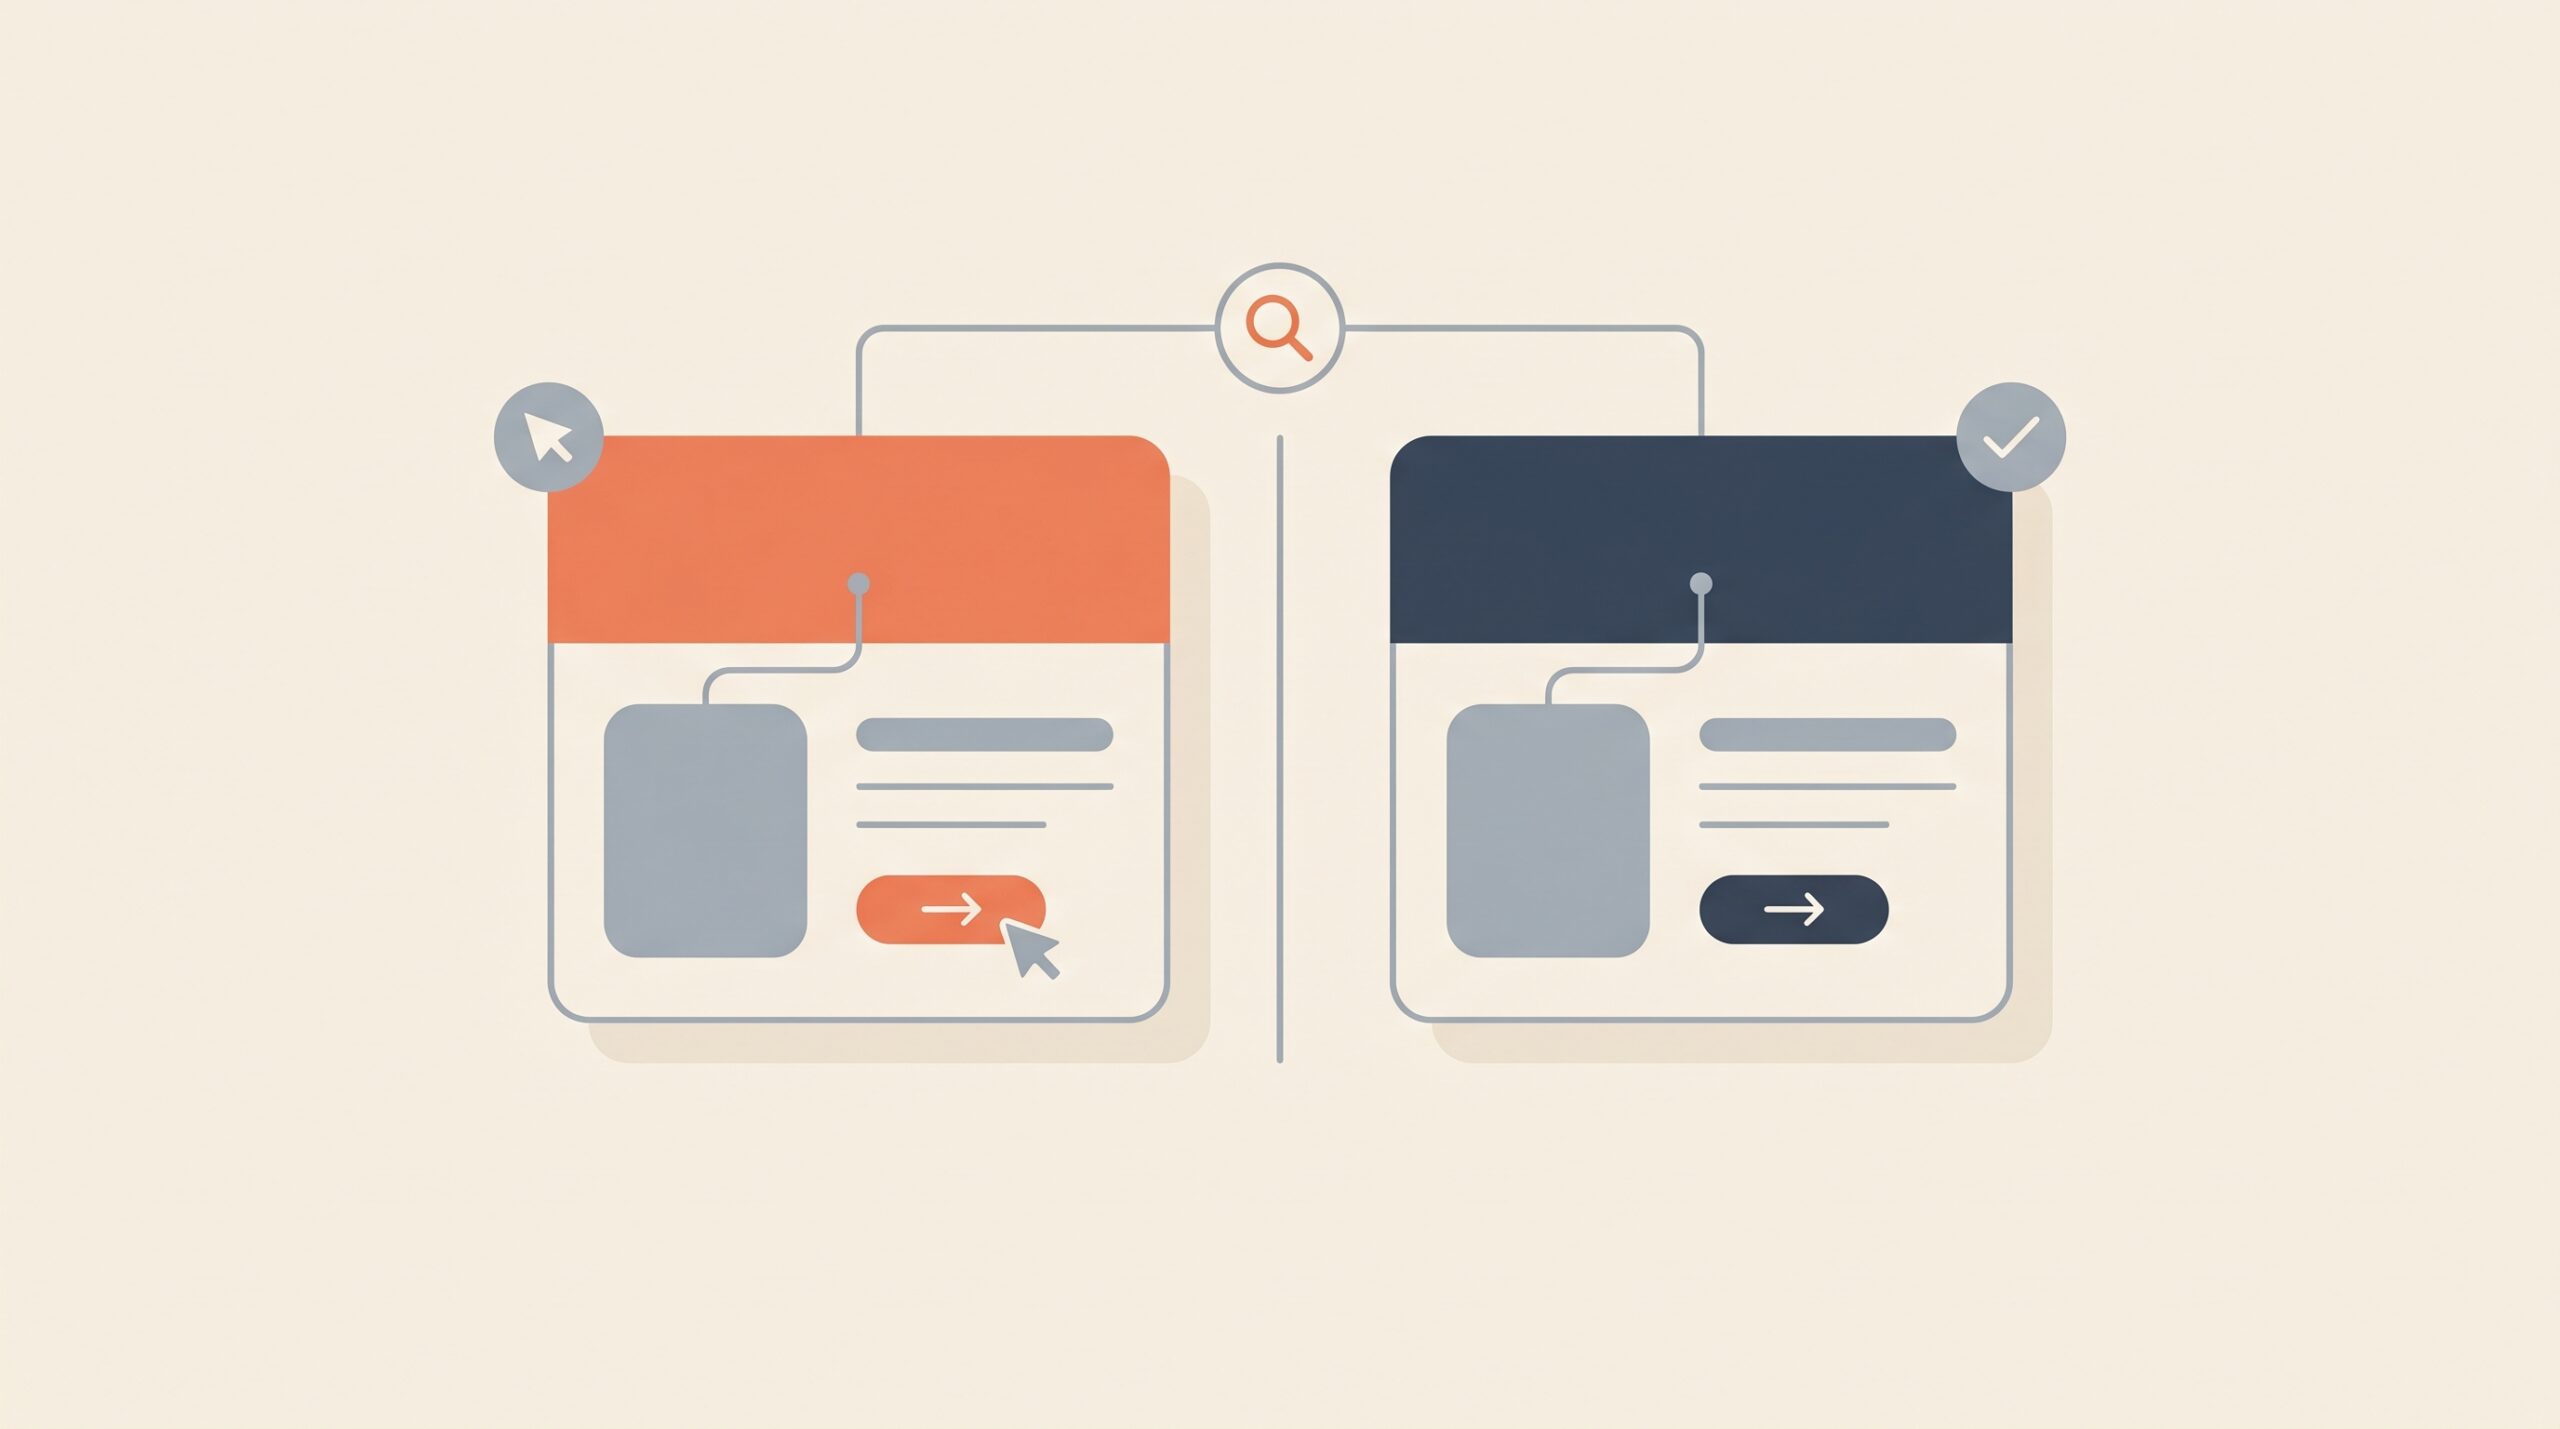
Most product pages get redesigned on opinion. Someone senior dislikes the hero image, the button gets a new color, and nobody ever finds out whether revenue actually moved. PDP A/B testing replaces that guesswork with evidence — but only if you test the things that genuinely change buying decisions and run each test long enough to trust the result. This guide covers what’s worth testing on your product detail page in 2026, how to size a test so the number means something, and what to stop wasting cycles on.
What’s worth testing on a product page
Prioritize elements that touch the buying decision directly. Hero media — lifestyle vs studio lead image, gallery depth, adding a product video — is usually the highest-value experiment, especially for apparel and anything where fit or scale is hard to judge. The buy box — button label, a sticky mobile add-to-cart, variant clarity — is next. Social proof placement (a rating summary directly under the title vs lower down) and shipping/returns messaging pulled up near the buy box round out the high-leverage list.
A priority view of common PDP tests
| Element to test | Hypothesis | Typical impact / priority |
|---|---|---|
| Lead image: lifestyle vs studio | Context raises confidence to buy | High — strong on visual categories |
| Product video / 360 view | Richer media answers fit/scale questions | High for high-consideration SKUs |
| Sticky add-to-cart (mobile) | Keeps CTA in view at peak intent | High — reliable mobile win |
| Review summary near title | Early social proof lowers risk | Medium-high |
| Shipping & returns above the fold | Removes cost uncertainty early | Medium-high |
| Button color only | Higher contrast gets noticed | Low — usually noise |
Sample size and significance: the part teams skip
Before launch, fix three things: baseline conversion rate, minimum detectable effect, and confidence threshold (95% standard; 99% for pricing). Feed them into a sample-size calculator. The math surprises people: on a 5% baseline, detecting a 20% relative lift takes ~15,000 visitors per variation; a 5% relative lift takes ~240,000. Your real sample is purchases, not pageviews, so a store under ~100 orders/month should test bold changes, not tiny ones. Run every test a full week or two, and never peek-and-stop — only about one test in seven is a genuine winner.
What’s NOT worth testing in 2026
- Trivial cosmetics (button shade, corner radius) — noise you’ll mistake for signal.
- Tests your traffic can’t power — use session replay and surveys instead.
- Multi-element redesigns dressed up as one test — you won’t know what moved.
- “Why” questions — A/B tells you which won, never why.
- Obvious fixes (broken mobile gallery, missing price) — just ship them.
Frequently Asked Questions
If you’d rather hand the testing roadmap to a team that builds and runs this on WooCommerce and Shopify every day, book a call with The Reach Bureau.
Ready to scale your e-commerce?
Let's discuss your project and how we can help you achieve your growth goals.